
CompletedRustTypeScriptNext.js+3 more
Attention Is All You Need
An interactive dashboard that visualizes Scaled Dot-Product Attention in real time, with a Rust backend streaming tensor math to a Next.js frontend.
Timeline
1 Week
Role
Full Stack Engineer
Team
Solo
Status
CompletedTechnology Stack
Rust
TypeScript
Next.js
React
Tailwind CSS
WebSockets
Key Challenges
- Implementing matrix multiplication and causal masking in Rust
- Streaming multi-dimensional float arrays over WebSockets at 60fps
- Rendering huge matrices without bloating the DOM
- Drawing attention flows as live SVG curves
Key Learnings
- The math behind Scaled Dot-Product Attention
- Async WebSocket servers with tokio and axum
- Canvas rendering for large data grids
- Global state management with zustand
Attention Is All You Need
Situation
Attention is the core operation inside every modern large language model, yet it is usually explained as a formula on a slide. The steps (Query and Key dot products, causal masking, softmax, weighting the Values) are easy to recite and hard to picture. I wanted a tool that lets you watch the numbers move.
Task
Build an interactive dashboard that:
- Visualizes Scaled Dot-Product Attention in real time, from raw tensors to the final prediction.
- Shows the actual float values behind each matrix, not just a heatmap.
- Predicts the next token with a confidence score, so the output of attention is visible too.
- Stays fast enough to feel instant, even with large matrices.
Action
I split the project into a Rust backend for the math and a Next.js frontend for the visuals, connected by WebSockets.
1. Rust math engine
- Built on
tokioandaxumfor asynchronous WebSocket streaming. engine.rsperforms the matrix multiplications (Query/Key dot products) and applies causal masking.- Streams multi-dimensional float arrays to the client at 60fps.
- A next-token engine simulates trained model weights and returns a prediction with a confidence score.
2. Interactive frontend
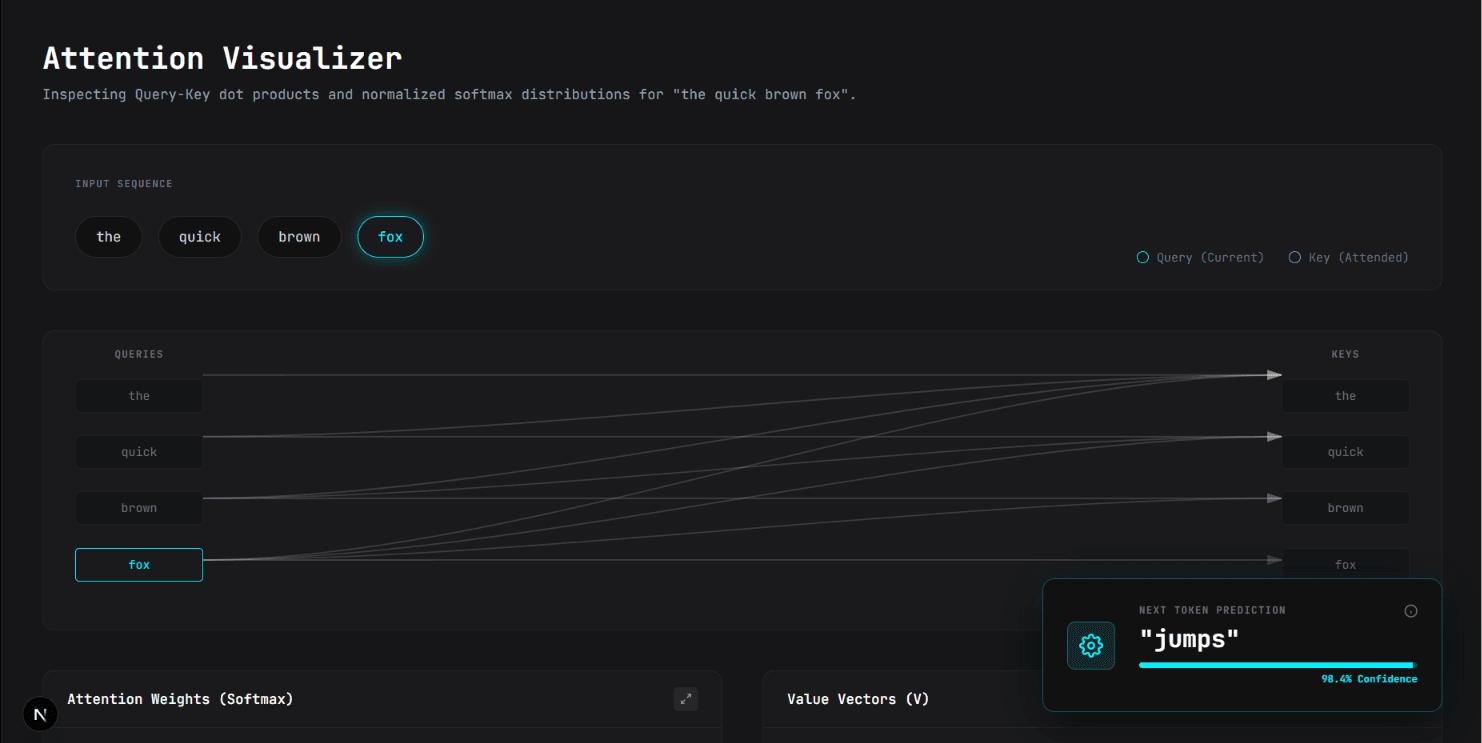
- Tokenizer playground: hovering a token in the input sequence instantly highlights its attention mappings.
- Causal SVG graph: real-time bezier curves connect Queries to Keys, showing the causal flow of attention.
- Matrix dashboards: expandable, color-coded views of Query, Key, Value and Softmax attention weights, with values shown to 4 decimal places.
- State lives in
zustand, and a custom HTML5<canvas>renderer (MatrixCanvas.tsx) draws the big grids without creating thousands of DOM nodes.
3. Design
- A dark "Neural Insight" theme with glassmorphism panels, built with Tailwind CSS.
- JetBrains Mono throughout, so the numbers line up.
Result
- Attention you can see: each step from dot products to softmax weights to the predicted token is visible and inspectable.
- Smooth at scale: the Rust backend and canvas rendering keep large matrices responsive.
- Honest about its limits: the backend is deliberately coded to associate "the quick brown fox" with "jumps", to show how a model would learn a pattern. A real LLM learns these weights by gradient descent over terabytes of text.